
Markets tend to obsess over earnings per share and quarterly profit growth. But when you’re looking at capital‑intensive businesses in the middle of a capacity build‑out, reported profit is often the noisiest number in the entire financial statement.
One of the more interesting case studies in India right now is a plastic labware company that has quietly become the domestic leader in its niche, while the stock market punishes it for doing exactly what long‑term owners should want: investing ahead of the curve.
The cash flow vs. PAT illusion
Through the first half of FY26, this company reported what headlines called “mixed results”:
Revenue up a modest 5.2% year‑on‑year to about ₹194 crore.
EBITDA up 18.4% to roughly ₹52 crore, with margins expanding by 300 bps to 26.9%.
But profit after tax down sharply, hit by accelerated depreciation and higher finance costs from a new facility.
If you stop at PAT, the story looks ugly. If you look at cash, it looks very different.
Why Cash Beats Profit (Cash is the King)

Investors talk about revenue growth, margins, and EPS. But the only thing that actually pays investors — dividends, buybacks, debt repayment, or reinvestment that creates value — is cash. Prof. Damodaran’s central teaching is simple: value is the present value of expected cash flows
On a consolidated basis, Cash PAT (PAT plus depreciation) grew 20.8% year‑on‑year to ₹47.5 crore in H1 FY26. Operating cash flow remained strong, because the underlying business continues to throw off cash even while reported earnings are compressed by non‑cash depreciation from the new plant. This is textbook “profit misleading, cash real” behavior you expect during the trough of a capex cycle.
In earlier quarters, the divergence was even starker. In Q1 FY26, standalone PAT fell sharply due to nearly doubling of depreciation, yet standalone Cash PAT grew 38% and consolidated Cash PAT grew 44%. Operationally, things were improving; the income statement just wasn’t telling that story yet.
If you anchor on PAT, you’d conclude the moat is breaking. If you anchor on cash flow discipline, you see something else: a business that is funding its expansion from internally generated cash, maintaining or improving margins, and eating the short‑term optics hit in order to build a larger earnings base for later.
The moat: boring plastic, non‑boring economics
Labware is not glamorous. You’re talking about tubes, pipette tips, bottles, plates, and other consumables that live in every biology and chemistry lab. But there is a quiet moat in this space if you build it correctly.
This company sits on roughly a 20–25% share of the Indian plastic labware market, with some analyses pegging it even higher in specific consumables. The domestic market itself is estimated around ₹1,200 crore and growing at about 10% annually, driven by a long‑term shift from glass to plastic for durability, ease of handling, and cost.
The core of the moat has three components:
1. In‑house, scaled manufacturing
The company runs some of the largest integrated plastic labware facilities in India, effectively doubling capacities in recent years to address the full domestic market. This gives it cost control, quality control, and reliable delivery in a segment where many global peers still export into India.
2. Structural gross margins
Despite the industry being “commoditised” at first glance, standalone gross margins have sat in the 70%+ band, actually expanding to around 72% in early FY26. That’s not what you see in a price‑taker commodity; that’s what you see when a local cost advantage and distribution network let you undercut MNCs on price while still earning fat unit economics.
3. Distribution and switching friction
The company services India through a dense distributor network and direct relationships with research labs, hospitals, and diagnostics. Once a lab standardises on a particular brand for critical consumables, switching is non‑trivial: it requires validation, QC runs, and often regulatory documentation. That friction quietly reinforces the moat.
Put together, you get a business that looks unglamorous from the outside but generates high‑quality, recurring cash flows with high structural margins and decent pricing power. That alone would be enough for a solid compounder.
But the real story begins when you add cell culture.
Cell culture: from adjacency to growth engine
Cell culture consumables sit one layer “up the stack” from generic labware. Instead of just holding liquids, these products interact with living cells—T cells in CAR‑T therapies, monoclonal antibody‑producing lines, iPSC systems, and more. The risk of contamination is higher, regulatory expectations are stricter, and the value per unit is much greater.
Globally, the cell culture market has been growing at double‑digit CAGRs, fuelled by biologics, biosimilars, and advanced therapies. India is now explicitly positioning itself as a biopharma manufacturing hub, with the 2026 Union Budget launching “Biopharma Shakti”, a ₹10,000 crore initiative over five years aimed at building end‑to‑end biopharma innovation and manufacturing capacity.
That includes:
A networked innovation and manufacturing ecosystem for biologics.
New and upgraded pharma institutes.
A planned grid of ~1,000 accredited clinical trial sites.
Every one of those nodes uses labware. Many of them will eventually need cell culture vessels, bioprocess bottles, and related consumables.
The labware company in question has spent the last few years building a new facility dedicated to cell culture and bioprocess plastics. This plant (often referenced in filings as the “Panchla” facility) has driven the spike in depreciation and finance cost that crushed reported PAT, but is exactly where the next leg of growth will come from.
A few things stand out:
• Management and disclosures have indicated that expanded capacities and new products from this facility are expected to contribute meaningfully from FY27 onwards.
• H1 FY26 already shows the capex pain (depreciation) but essentially none of the corresponding revenue upside yet—classic J‑curve behavior.
• Cash PAT and EBITDA are rising despite this, which suggests that the core labware engine is underwriting the build‑out of cell culture without external equity dilution.
In other words, the existing moat is funding the new growth engine.
Why the market is struggling to price this
From a distance, the narrative most investors see is simple:
• Revenue up low‑single‑digit,
• PAT down 60%+,
• Stock down 60–70% from its peak,
• New facility not yet showing in revenue.
That looks like a broken story.
Under the hood, the cash flow statement tells a different story:
• Revenue up 5.2% YoY in H1 FY26.
• EBITDA up 18.4% YoY, margin up 300 bps.
• Cash PAT up 20.8% YoY to ₹47.5 crore.
• The delta between PAT and Cash PAT is almost entirely explained by depreciation from the new capacity.
This is exactly the pattern you expect when a company moves from “steady state labware supplier” to “labware + cell culture platform”:
1. You invest in high‑spec capacity.
2. Depreciation and finance costs go live from day one.
3. Customers take 12–24 months to qualify new cell culture products.
4. For that window, the P&L looks worse while the balance sheet and cash flows quietly set up the next S‑curve.
Most screeners pick up “PAT down, P/E optically high, stock down” and throw it into the “value trap” bucket. Very few are bothering to notice that cash economics are improving and the incremental capital is going into a structurally higher‑growth, higher‑value adjacency.
How I think about it as an investor
My mental model for businesses like this is,
Primary filter: cash discipline.
If operating cash flow and Cash PAT are growing healthily through the capex cycle, I’m inclined to treat PAT compression as cosmetic. In this case, a ~21% Cash PAT growth in H1 FY26 with 300 bps EBITDA margin expansion passes that test comfortably.
Moat check: gross margin and mix.
Sustained 70%+ gross margins in a space where most MNCs import into India is a strong signal that the company has a durable cost and distribution edge. If gross margins were sliding while capex was ramping, I would be far more cautious.
Optionality check: is the new engine real or narrative?
Here, the capex is in a segment (cell culture & bioprocess) where global demand is visibly compounding, and policy (Biopharma Shakti) is actively trying to pull that demand onshore. That is very different from capex into yet another “me‑too” product.
If those three boxes are ticked—cash discipline, moat intact, and a genuine growth adjacency—then temporary PAT crashes are often precisely when the risk‑reward gets interesting.
Let's take a deep dive into the company

Tarsons is effectively using its core labware moat to underwrite a second, higher‑growth engine in cell culture, and the way that engine is being built lines up almost perfectly with India’s new biopharma push.
In simple terms, here’s how Tarsons stands to benefit:
Doubling its addressable market with the same moat
Management has been explicit that the new Panchla facility is designed to enter cell culture and bioprocess consumables and nearly double the addressable market, on top of the existing labware base. They’re not wandering into an unrelated business; they’re extending plastics and sterile manufacturing capabilities into a more demanding, higher‑value segment that serves the same end‑customers.
Using a cash‑rich core to fund the build‑out
Even in H1 FY26, while PAT is depressed by depreciation from Panchla, Cash PAT and operating cash flows are growing, and EBITDA margins are expanding. That means the existing labware franchise is effectively paying for the cell culture experiment without needing dilution or leverage blow‑outs. When the cell culture lines start contributing meaningfully from Q4 FY26 and ramp through FY27–FY28, those new revenues will drop into an already proven cash machine.
First mover in domestic cell culture plastics
On recent calls, management has underlined that they are effectively the only player with a dedicated cell culture facility in India right now, and that this should give them a 1–2 year early‑mover advantage as the domestic cell therapy and biologics ecosystem scales. In a world where Biopharma Shakti is about making India a global biopharma hub, being the first local manufacturer of sterile cell culture and bioprocess plastics is a strategic position, not just a product extension.
Product and revenue ramp already starting, with clear timelines
Panchla Phase 1 has begun commercial production of bioprocess SKUs like PET/PETG bottles and roller bottles; customer approvals have started and management is seeing “good response,” though not yet at scale. Cell culture lines are in commissioning, with management guiding for initial cell culture revenue from Q4 FY26 and a full‑scale ramp over the next two financial years. External research notes estimate Panchla (plus the related Amta sterile facility) could support ₹350–400 crore peak revenue over 3–5 years, with a significant chunk of that from cell culture and high‑value consumables.
Natural leverage to India’s biopharma capex and policy tailwinds
The Union Budget’s ₹10,000 crore Biopharma Shakti program is aimed at building biologics and advanced therapy manufacturing capacity, clinical trial infrastructure, and an integrated innovation ecosystem. Every biologics plant, GMP suite, and trial site increases the demand for sterile, validated cell culture and bioprocess consumables. Tarsons is positioning Panchla and Amta exactly to supply that incremental demand domestically, rather than letting it be served entirely by imported consumables.
Operating leverage once utilization kicks in
Right now, depreciation from Panchla is fully in the P&L, but utilization is low; management is targeting 70–75% utilisation within three years of full commercialisation. As cell culture and bioprocess volumes ramp, the fixed cost of the new plant gets spread over more revenue, which is why even conservative models show EBITDA margins and free cash flow expanding as you move into FY27–FY28. The existing labware moat (70%+ gross margins, strong cash conversion) magnifies that operating leverage.
Closing thought
The Indian equity market is slowly getting better at rewarding compounders, but it still tends to overreact to optical PAT swings, especially in capex‑heavy stories. In labware and cell culture, that creates a peculiar window: a business with a proven domestic moat, expanding capacity into a structurally growing segment, in a country that has just announced a ₹10,000 crore push to become a global biopharma hub.
From the outside, it looks like “profit down, stock down.”
From the cash flow statement, it looks more like a labware cash machine quietly being re‑tooled into a cell culture platform.
That difference—between what the P&L says today and what the cash and capacity are setting up for tomorrow—is where the most interesting mispricings usually live.
Core Thesis: From Moat to Platform
The labware moat is the foundation: high gross margins (~70%+), sticky customer relationships, recurring demand, and proven cash generation even during capex cycles. This isn’t a business that needs constant reinvention—it compounds quietly by serving the non-negotiable needs of every research lab, diagnostic center, and quality control facility in India.
Disciplined cash flows are the filter: when a company can absorb the depreciation hit from a major capacity expansion while still growing Cash PAT 20%+ and expanding EBITDA margins, it signals that the core economics are sound and management isn’t betting the farm on unproven adjacencies.
Cell culture is the leverage: it doesn’t replace the labware engine—it sits on top of it. Same manufacturing DNA (injection molding, cleanroom operations), same customer base (the labs buying pipette tips today will need cell culture flasks tomorrow), but higher value per unit, tighter specs, and exposure to the fastest-growing segments of biopharma: biologics, biosimilars, CAR-T, and cell therapies.
When you combine:
• A proven, cash-rich core that funds its own expansion,
• A structural moat that keeps competitors at bay in labware, and
• A new growth engine in cell culture that addresses a market nearly double the size of the base business, ramping exactly as India commits ₹10,000 crore to becoming a biopharma hub…
…you get a setup where the downside is anchored by labware cash flows, and the upside is option value on cell culture scaling into a multi-year policy and demand tailwind.
Tarsons isn’t pivoting away from labware—it’s using the labware moat as a cash-generating platform to build a second, higher-growth engine in cell culture, right as India’s biopharma ecosystem inflects.
That framing makes it clear this isn’t a speculative “new story” bet—it’s a quality compounder adding a credible growth layer on top of an already durable foundation.
DISCLAIMER
The content published in this post is intended solely for educational and informational purposes. I am not registered with SEBI as an investment advisor, research analyst, broker, or financial influencer, and nothing in this post should be construed as investment advice, stock recommendations, or solicitation to buy, sell, or hold any securities.
This analysis is part of my personal learning journey in finance and valuation, heavily influenced by academic frameworks and publicly available material from Aswath Damodaran, particularly his work on discounted cash flow (DCF) and cash-flow-based valuation.
The post reflects my own interpretation and application of these concepts as a finance student and practitioner, and any errors or assumptions are entirely my own.
The valuation models, assumptions, scenarios, and conclusions presented here are illustrative learning exercises, not predictions. They do not account for individual financial circumstances, risk tolerance, tax considerations, or investment objectives.
Readers are strongly encouraged to perform independent due diligence and/or consult a SEBI-registered financial professional before making any investment decisions. I shall not be responsible for any financial losses or outcomes resulting from reliance on this content.
🔍 Holdings & Transparency Disclosure
Disclosure of Personal Holdings
Where applicable, I disclose my personal holdings in the discussed securities, including approximate portfolio allocation percentages and unrealized profit/loss as of the mentioned date, purely in the interest of transparency.
Such disclosure does not constitute a recommendation or endorsement. My positions may change at any time without notice, and I am under no obligation to update previous disclosures or analyses.
My personal holdings of Tarsons dated on 2nd Feb 2026 (against overall Portfolio)
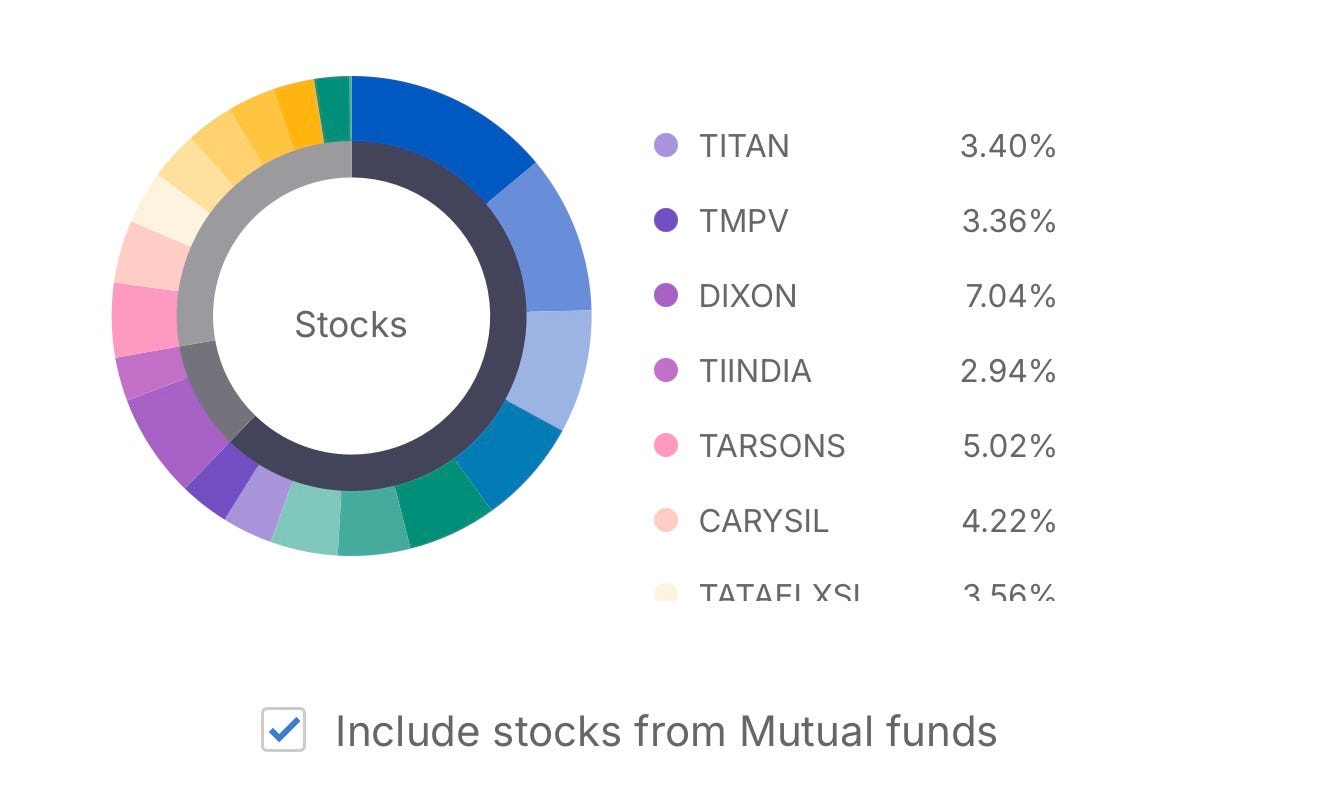
And currently sitting at ~-41% (Losses) of my investment in Tarsons
📚 Academic Reference
Methodology Reference
Cash-flow analysis and valuation structure in this post are inspired by publicly available lectures, blog posts, and case studies from Aswath Damodaran (NYU Stern), particularly his writings on intrinsic valuation and discounted cash flow modeling.
Need more articles like this!! Learnt about depreciation and non cash expense &how to evaluate at such stages..
its falling like there's no tommorow with such strong Operating Cash Flows. PAT fools you big time. great article 👍