
The Problem, in One Sentence
The N+1 query problem is what happens when fetching N items costs you N+1 round trips to a data store instead of one — and it is, without much competition, one of the most common performance bugs I see in software that talks to a database.
I want to write about it here not because we hit the textbook version. We didn’t. What we ran into while building a new feature for Parjanya were two close cousins of N+1, caught at different points in the same week.
What made the experience worth writing about was the pattern-matching involved. Once I started asking “how many times does this data actually need to leave the system?” rather than just “does this code work?”, both problems became much easier to see.
I think that is a useful engineering habit for anyone building on top of an ORM, a NoSQL table, or a cloud API with a batch endpoint nobody on the team has used yet.
Why N+1 Gets Its Own Name
Picture the canonical example, the one I have either written or fixed more times than I’d like to admit: I load a list of blog posts, then loop over them to print each author’s name.
posts = Post.objects.all()          # 1 query
for post in posts:
    print(post.author.name)         # N queries — one per post
One query becomes N+1 queries.
With 10 posts, that’s mildly wasteful. With 10,000 posts loaded on an admin page, it can be the difference between a 200ms response and a request that never comes back.
Once I started looking for the shape rather than the syntax, I found it everywhere: a GraphQL resolver fetching a Book per Author node instead of batching with a DataLoader; a Rails view calling .comments.count inside an each block; a microservice calling GET /users/:id once per row instead of POST /users/batch.
Different stacks, same root cause — a per-item operation standing in for a single query or batch operation the data layer was perfectly capable of running.
What makes N+1 worth having a name of its own, rather than simply calling it “a slow endpoint,” is how it hides.
The loop looks correct in code review. It is correct — just expensive.
Unit tests don’t necessarily expose it either. A fixture with three rows produces three extra queries, but nobody notices when the entire test takes 40ms.
It usually becomes visible only with real data volume: a production dashboard gets slower, a support ticket says a page “used to be fast,” and by then the same pattern has often been copied into two other endpoints.
That’s why I care about catching this class of problem early. The fix can be a five-line change when I catch it during design or review. Once the data has grown into the architecture, the same fix can become a multi-file refactor with a production incident attached.
Our Version Wasn’t the Textbook Case — Which Is Exactly the Point
At Parjanya, we don’t run a traditional ORM — no ActiveRecord, no Django QuerySets, no lazy-loaded relationships waiting to surprise us.
Our data layer is DynamoDB, queried directly, with explicit asyncio.gather calls instead of implicit lazy loading.
At first glance, that seems like it should rule out N+1 entirely. Nothing is silently issuing a query behind a property access.
It doesn’t.
It just changes the shape of the problem.
We found two variants in the same week while building the same feature, and neither looked anything like the classic blog-posts-and-authors example.
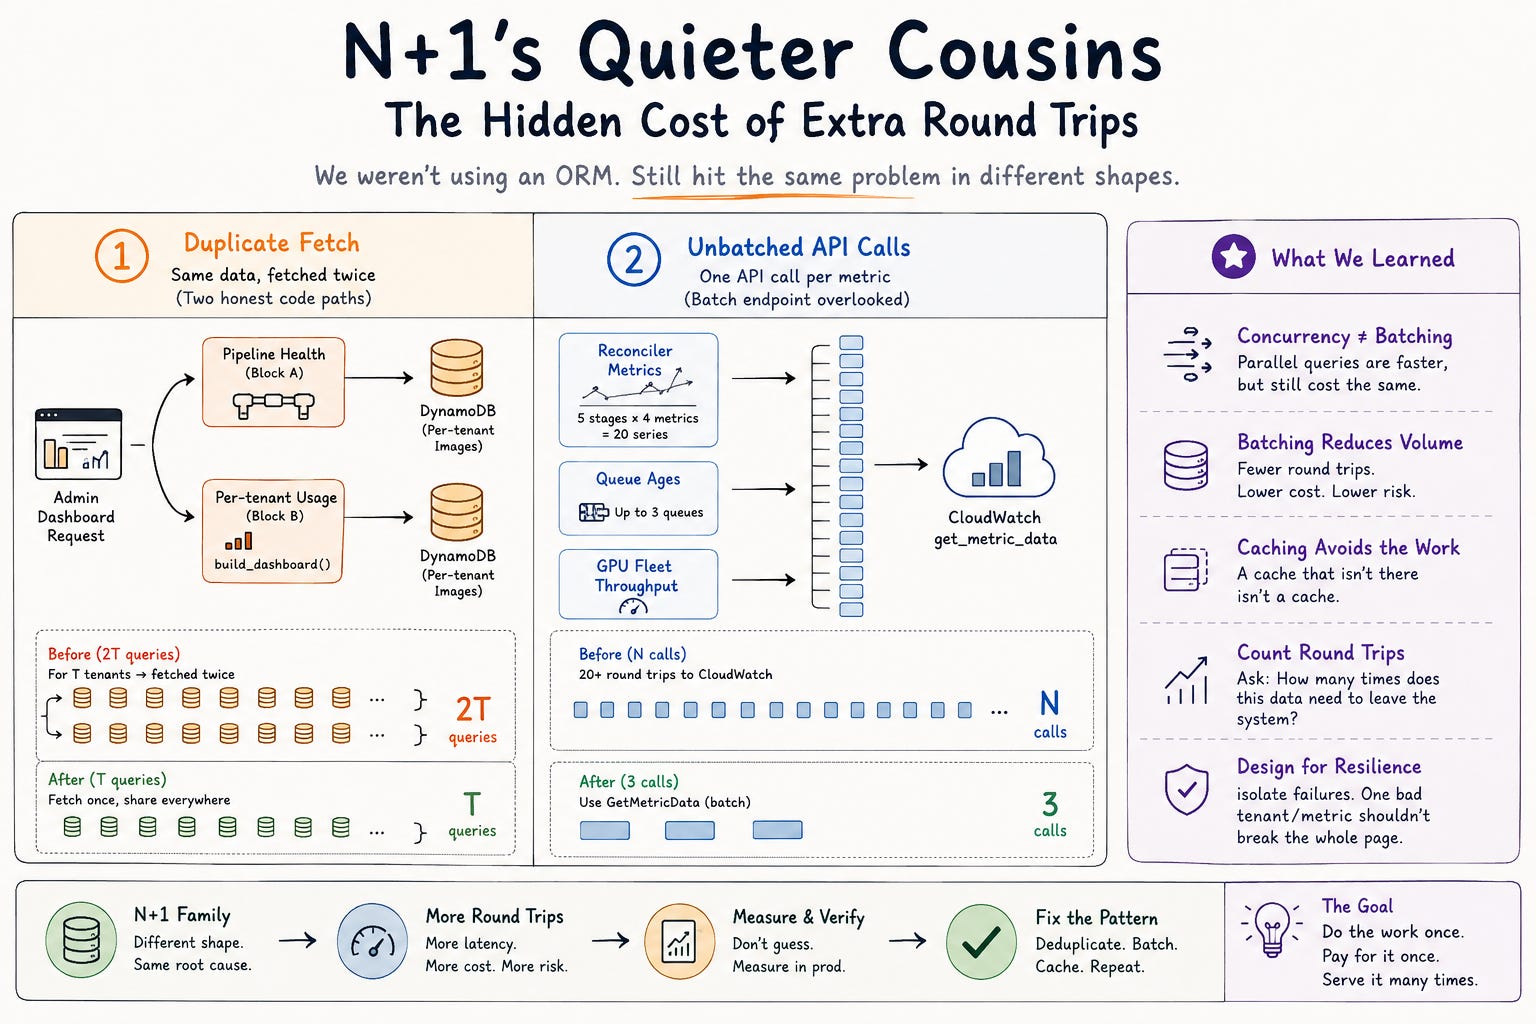
Cousin #1: The Same Partition, Fetched Twice by Two Honest Code Paths
In mid-July, we built GET /api/v1/admin/dashboard — a cross-tenant operations view for Parjanya: pipeline health, queue depth, GPU fleet state, reconciler activity, and a per-tenant usage/cost table, all on one screen for whoever’s on call.
Two of those blocks needed the same underlying data.
The pipeline-health block needed every tenant’s image records to compute stale-pending buckets.
The per-tenant table needed the same tenant’s image records to compute that tenant’s usage numbers — through UsageMetricsService.build_dashboard, a method that already existed and already queried DynamoDB for exactly this.
The straightforward implementation would have called build_dashboard once per tenant, which queries that tenant’s image partition, and then separately queried the same partition again to build the pipeline block.
For T tenants, that meant 2T DynamoDB queries against partitions we only needed to read once each.
There was no obvious for tenant_id in tenant_ids: await fetch(tenant_id) loop. Nothing screamed “N+1.”
Instead, I had two well-intentioned pieces of code, written for two different sections of the same page, each doing the right thing in isolation and the wrong thing together.
We caught it before it merged by asking the same question the textbook N+1 case teaches us to ask:
How many times does this data actually need to leave DynamoDB?
The answer was once.
So we fetched it once:
# One image-field fetch per tenant, shared by the pipeline block AND
# the per-tenant usage dashboards (build_dashboard accepts prefetched
# images) — avoids double-charging the DDB partitions.
images_by_tenant = await self._fetch_images(tenant_ids, attention)

results = await asyncio.gather(
    self._pipeline_block(images_by_tenant, days, now),
    ...
    self._tenants_block(tenant_configs, images_by_tenant, days, now, email_by_tenant),
    return_exceptions=True,
)
Then I changed build_dashboard so it could accept data the caller had already fetched instead of insisting on fetching it again:
async def build_dashboard(
    self,
    tenant_id: str,
    days: int,
    images: list[dict[str, Any]] | None = None,
) -> UsageDashboardResponse:
    """Build the dashboard; ``images`` lets callers that already fetched
    the tenant's image fields (admin dashboard) avoid a second query."""
    if images is None:
        images = await self.db.query_image_usage_fields(tenant_id)
One parameter. One shared dictionary threaded through two call sites.
2T queries became T.
There is an important detail here that I think is easy to miss.
We didn’t make the T queries sequential. They still run concurrently through asyncio.gather, one per tenant.
That distinction matters because concurrency can fool me into thinking I’ve fixed the problem.
Concurrency hides N+1’s latency cost.
T parallel queries can sometimes return in roughly the time of one query.
But concurrency does nothing to reduce the volume cost.
I’m still paying for T reads against T partitions. I’m still consuming T times the read capacity. And I’m still one slow or misbehaving tenant away from holding up the batch.
A parallel N+1 is faster to run and just as expensive to pay for.
The fix that matters is cutting the fetch count, not merely parallelizing it.
Cousin #2: An API With a Batch Endpoint You Forgot Existed
The same dashboard also needed CloudWatch metrics — reconciler activity across five pipeline stages times four counters each, giving us 20 data series, SQS queue ages for up to three queues, and GPU fleet throughput.
The naive implementation would have made a get_metric_data call per series.
That’s 20 calls for the reconciler block alone, plus one per queue, plus one for fleet throughput.
Every one of those is a network round trip. Every one is a CloudWatch API call subject to its own rate limits. Every one has its own chance to fail independently in the middle of the request.
This is probably the most common shape of N+1’s cousin that I now look for: not a data-modeling problem, but a case where I forgot that the SDK already has a native batch primitive for exactly what I’m trying to do.
boto3‘s CloudWatch client accepts a list of MetricDataQueries in a single get_metric_data call — up to 500 of them — and returns the results together.
So I built one small helper around that and used it everywhere we needed metrics:
async def _get_metric_data(
    self, queries: list[dict[str, Any]], start: datetime, end: datetime
) -> dict[str, float]:
    """One batched GetMetricData; returns {query_id: latest/sum value}."""
    resp = self.cloudwatch.get_metric_data(
        MetricDataQueries=queries, StartTime=start, EndTime=end,
        ScanBy="TimestampDescending",
    )
    ...
The reconciler block builds all 20 queries — 5 stages × 4 metrics — as one list and makes one call.
The queue-age lookup builds one query per queue and makes one call.
Fleet throughput reuses the same helper.
Twenty-some potential round trips collapsed into three calls for the whole dashboard build: one per logical block, not one per metric.
And I didn’t want the batching optimization to compromise resilience.
We kept the per-tenant and per-block exception isolation through asyncio.gather(..., return_exceptions=True).
That means one broken AWS permission or one tenant’s bad data can still degrade that panel to a signal_unavailable note instead of taking down the entire request.
For me, that’s an important architectural point: batching and graceful degradation aren’t in tension. I just have to design for both instead of treating “make it one call” as permission to let one failure take down everything.
Both of these changes shipped in the same commit, feat(admin): per-environment admin dashboard API, alongside 11 new tests.
Neither would have shown up on a code-review checklist that only asked, “Is there a loop calling the database?”
The first problem was two separate, individually-correct code paths.
The second was a missed SDK capability.
The habit that catches both is the same habit that catches classic N+1:
Before I merge anything that talks to a data store or external API more than once, I want to know exactly how many round trips it costs and whether that number scales with something that’s about to grow.
The Sequel: Batched Isn’t the Same as Cached
This is actually the part of the story I find most useful, because from the outside it looked like we’d already solved the problem.
Four days after that commit, I was checking why admin dashboard loads still felt sluggish when we found this:
Verified live: no ElastiCache exists in any deployed environment (zero clusters, no VALKEY_* env vars), so ValkeyCache silently no-ops and every dashboard load was a full rebuild (~29s admin builds, a Cost Explorer call per view).
We had designed the endpoint to be cached.
There was a ValkeyCache layer wired in from the start, a 3-minute TTL, and the whole shape of what looked like a normal caching story.
What we hadn’t verified was the one thing that mattered:
Did the cache actually exist in any running environment?
It didn’t.
ElastiCache had never been provisioned.
Every cache read quietly missed, every single time.
That meant every dashboard view was re-running the entire fan-out we’d just finished optimizing: T parallel DynamoDB queries, three batched-but-not-free CloudWatch calls, and a Cost Explorer call none of us wanted running on every page load.
We had reduced the number of round trips per build from something like 2T+20 down to T+3.
And then we paid that reduced-but-still-real cost on every request because nothing was actually skipping the build.
That was the moment the distinction became very clear to me:
Fixing N+1-shaped fan-out is necessary, but it isn’t sufficient if the whole expensive operation still runs on every request.
A cache I haven’t verified in a running environment is, for all practical purposes, no cache.
And an unverified cache in front of a well-batched N+1 fix just means I’m repeatedly paying a smaller bill instead of a larger one.
The real fix didn’t require adding another managed service.
Instead, we used what we already had — the images table and the long-running ECS task — rather than depending on infrastructure that had quietly never existed:
A
SnapshotStorewrites gzip’d JSON dashboard snapshots into DynamoDB itself, with a read-timeexpires_atand a fail-open contract. Any DynamoDB hiccup degrades to a cache miss, which is just today’s behavior, never worse.A background warmer, running in the API process’s own lifespan, rebuilds the admin snapshot on a roughly 4-minute cadence and each tenant’s usage snapshot every 8 hours. We chose those cadences based on how often the underlying signals actually change, rather than picking arbitrary TTLs.
The Cost Explorer block gets its own 8-hour snapshot inside the costs block, since Cost Explorer data itself only refreshes a few times a day. That takes it from roughly one call per view to roughly three calls a day.
Both
/usage/dashboardand/admin/dashboardnow serve snapshots by default, with an explicitrefresh=trueescape hatch for anyone who genuinely needs the live number.
Nobody waits on a cold build anymore.
And, just as importantly, nobody is silently re-running a 29-second, multi-block AWS fan-out every time someone opens a browser tab.
Why Catching This Early Mattered More Than Usual, Here
Parjanya launched to its first self-serve trial cohort on 1st August.
Both fixes — the shared-fetch deduplication and batched metrics, followed by the snapshot cache that replaced a cache that never actually existed — landed before that date, while tenant counts were still near zero and nobody outside the team was looking at the admin dashboard.
That timing is the whole argument for dealing with N+1-shaped problems early.
At near-zero scale, 2T queries and T queries cost about the same amount of nothing.
A 29-second rebuild on every page view is merely annoying when I’m the only engineer clicking refresh.
None of this was a production incident.
But I could see exactly how it would become one.
As tenant count and dashboard traffic grew, the fan-out cost would scale linearly with exactly the number a growing SaaS product is supposed to grow.
The phantom-cache cost would scale linearly with exactly the traffic a real launch is supposed to bring.
We found both by asking a very simple question while the answer was still cheap to change:
How many round trips does this cost, and does that number grow with our own success?
I’d much rather answer that question before customers force me to.
What I’d Tell a Team Building This Kind of Thing
Ask the round-trip question before merge, not after a slow-page complaint.
For any code that touches a database or an external API more than once per request, I ask explicitly: how many round trips does this cost today, and what does that number scale with?
If the answer is “the number of tenants” or “the number of rows on this page,” that’s the moment to fix it — not a note for later.
A loop isn’t required for N+1’s cousins to exist.
Our duplicate-fetch case had no for tenant_id in tenant_ids: await fetch(tenant_id) shape at all.
It was two separately-written, individually-reasonable code paths that happened to want the same data.
I now watch for that pattern specifically: two features, built at different times, that each independently fetch “this tenant’s records” without either one knowing the other exists.
Check whether your SDK already has a batch verb before writing the loop.
CloudWatch’s GetMetricData takes a list.
So does DynamoDB’s BatchGetItem.
So do many well-designed cloud APIs from the last decade.
The fix for “N calls instead of one” is very often not custom code.
It is reading one more section of the SDK documentation.
Concurrency is not the same fix as batching.
asyncio.gather over N calls is faster than N sequential calls, and it is still N calls.
It hides the latency symptom without touching the cost or capacity symptom.
I don’t want a parallel version of the bug to pass code review as if it were the batched version.
A cache is a claim, not a fact, until I’ve verified it in every running environment.
The most expensive line in this whole story wasn’t a query.
It was an unprovisioned ElastiCache cluster that let a caching layer silently no-op for days while looking, in every log line and every code review, exactly like it was working.
If I can’t point to the cache-hit rate on a dashboard, I don’t want to assume the cache is working.
I want to verify it.
Small scale is when this is cheap to fix, not evidence that it doesn’t need fixing.
The version of this bug that costs nothing to run also costs almost nothing to fix.
The version that ships to production and grows with user count is the same bug, several engineer-days more expensive, with a support ticket attached.
Parjanya is the multi-tenant image QA platform we’re building at Phagyul for professional photographers. If your team has its own N+1 cousins — duplicate fetches across features that don’t know about each other, unbatched calls to an API that quietly supports batching, caches that looked wired but weren’t — I’d love to compare notes.
