
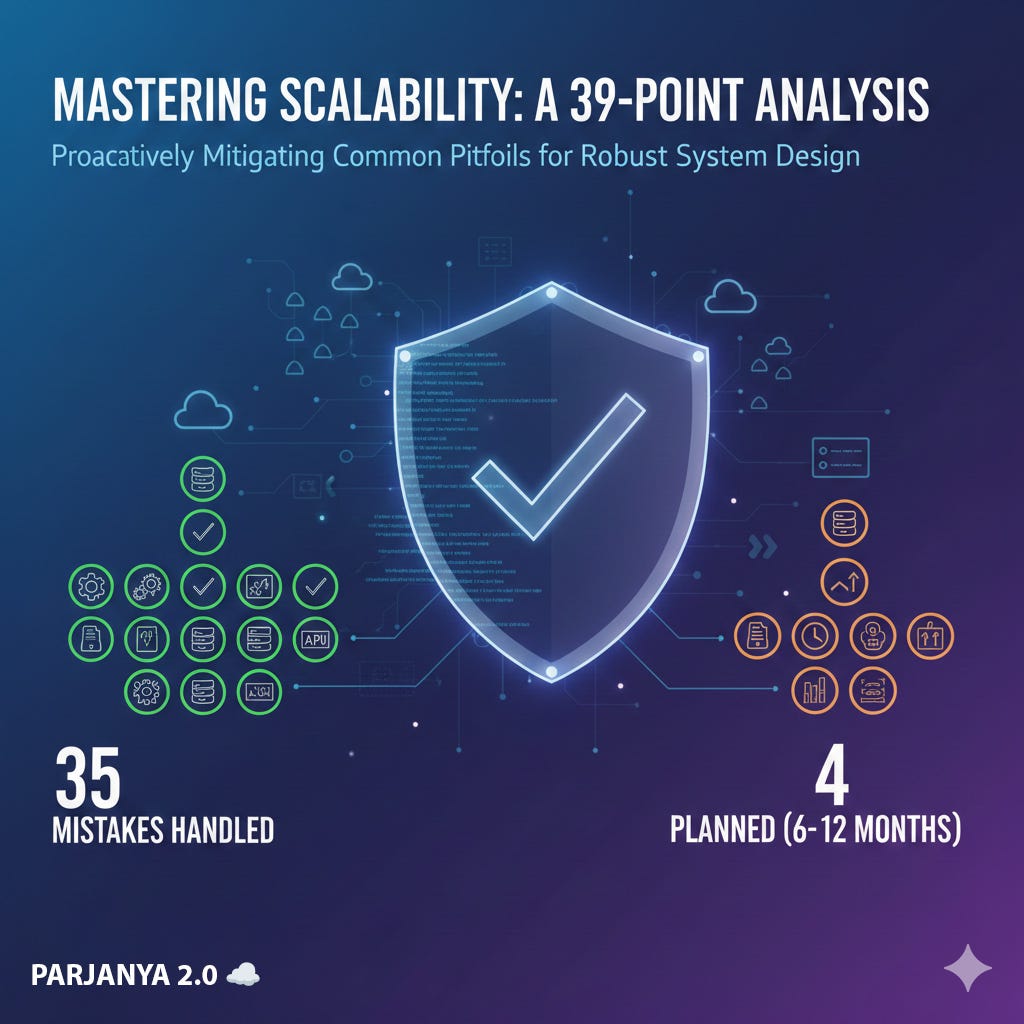
When I have come across Neo Kim post hit my mail box(who I follow regularly and highly recommend for everyone!) with the title “39 mistakes YOU make in scaling a system”, I found curious and I have recently redesigned Parjanya 2.0 and thought would do a check!
As per Neo Kim, Here are the biggest mistakes usually made while scaling a system:
Scaling vertically instead of horizontally (and hitting hard limits)
Adding “microservices” too early (plus unnecessary complexity)
Ignoring load balancing
Not using caching at all… and increasing system load linearly with traffic
Caching ‘everything’ blindly (causing stale data, memory pressure, complexity)
Forgetting CDNs for static assets
Keeping the server STATEFUL… (and limiting horizontal scalability + recovery)
Scaling compute before data (databases are usually the first bottleneck)
Treating the database as “infinite” storage
Not using read replicas
Sharding BEFORE understanding access patterns
Never indexing ‘critical’ queries
Allowing SLOW queries reach production… and amplify under load
Blocking requests with “synchronous” processing
Not using QUEUES for background jobs
Ignoring retries and back-off… transient failures are typical in distributed systems
Not setting “timeouts” (and causing thread exhaustion + cascading failures)
Forgetting RATE LIMITS
Letting failures ‘cascade’ by not using circuit breakers
Ignoring backpressure
Deploying ONLY to a single zone/region (and failing during zone/region outages)
No global traffic routing
Manual scaling instead of auto scaling (and moving slowly on traffic spikes)
Shipping without ‘load testing’
Never doing “capacity planning”
Storing big files in databases (instead of object storage)
Sending uncompressed payloads
Making “excessive“ network calls
Not BATCHING for writes
No ‘service discovery’
No failover strategy
No graceful degradation… and disrupting core functionality under load
Retries without ‘idempotency’ (and causing data corruption)
No observability,,, you cannot scale what you cannot measure
No monitoring alerts
No “tracing” across services in a distributed system
Scaling features instead of fixing BOTTLENECKS
‘Blindly’ copying big tech architectures
Believing scale is about tools,,, not tradeoffs
So, I cross verified with my new design (2.0) of Parjanya, and here are my findings,
TL;DR
Parjanya 2.0 avoids ~75% of these mistakes by design (SQS async, DynamoDB, Lambda/ECS, CloudFront, etc.). Areas of concern: 3 critical gaps + 2 nice-to-haves that should be addressed before year-end. No major architectural changes needed — only monitoring/observability additions and capacity planning documentation.
To go into the details,
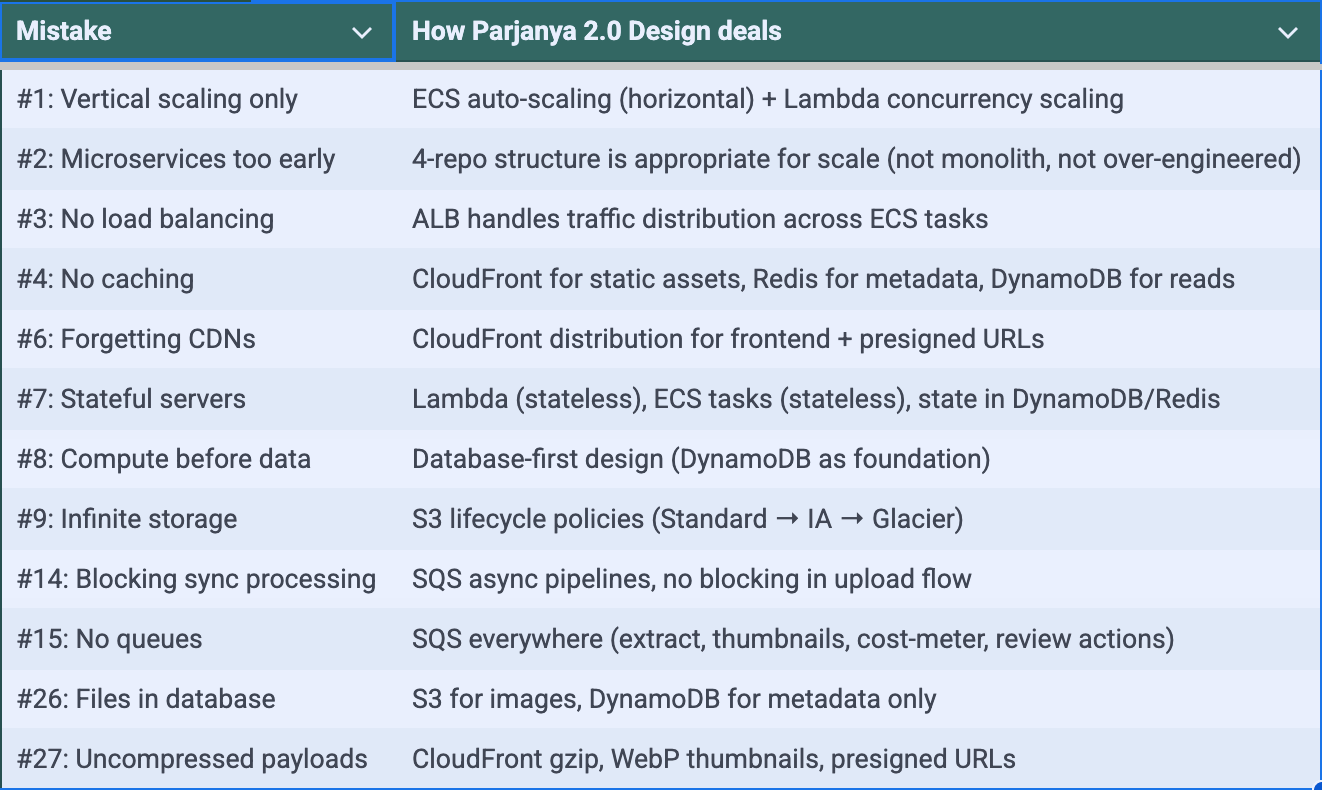
1. Mistakes Parjanya 2.0 DOES NOT Have ✅
2. Critical Gaps (Address Now) 🔴
Gap #1: No observability/monitoring/tracing (#34, #35, #36)
Current state: CloudWatch alarms only (basic).
What’s missing:
❌ No structured logging (CloudWatch Logs are text-based)
❌ No distributed tracing (X-Ray optional, not configured)
❌ No centralized metrics dashboard
❌ No error tracking (Sentry/Rollbar equivalent)
❌ No request latency tracking
To resolve:
# parjanya-image-iqa-service/app/middleware.py

from aws_lambda_powertools import Logger, Tracer, Metrics
from aws_lambda_powertools.utilities.typing import LambdaContext

logger = Logger()
tracer = Tracer()
metrics = Metrics()

@app.middleware("http")
async def logging_middleware(request: Request, call_next):
    """Structured logging for all requests"""

    trace_id = request.headers.get("X-Trace-ID", str(uuid4()))

    with tracer.trace(name="http_request", trace_id=trace_id):
        start_time = time.time()

        try:
            response = await call_next(request)

            duration = time.time() - start_time

            logger.info(
                "HTTP request completed",
                extra={
                    "method": request.method,
                    "path": request.url.path,
                    "status": response.status_code,
                    "duration_ms": duration * 1000,
                    "trace_id": trace_id,
                    "user_id": getattr(request.state, "user_id", "anonymous")
                }
            )

            metrics.add_metric(
                name="http_request_duration",
                unit="Milliseconds",
                value=duration * 1000
            )

            return response

        except Exception as e:
            logger.exception(
                "HTTP request failed",
                extra={
                    "method": request.method,
                    "path": request.url.path,
                    "trace_id": trace_id,
                    "error": str(e)
                }
            )
            metrics.add_metric(
                name="http_request_error",
                unit="Count",
                value=1
            )
            raise
Cost impact: AWS Lambda Powertools is free. CloudWatch Logs: ~$0.50/GB ingested.
Timeline: Add this in Month 1 of Parjanya 2.0 (before scaling beyond 300 users).
Gap #2: No load testing (#24)
Current state: Manual testing only (localhost, small batches).
What’s missing:
❌ No baseline performance metrics (latency, throughput)
❌ No spike testing (1000 concurrent uploads)
❌ No endurance testing (sustained load for hours)
❌ No breakpoint identification (when system fails)
To resolve:
# tests/load_test.py
from locust import HttpUser, task, between

class ParjanyaUser(HttpUser):
    wait_time = between(1, 5)

    @task(3)
    def sync_catalogue(self):
        """Simulate gallery sync (3× frequency)"""
        self.client.get(
            "/api/sync/user-123",
            headers={"Authorization": f"Bearer {self.token}"}
        )

    @task(1)
    def upload_initiate(self):
        """Simulate upload initiation"""
        self.client.post(
            "/api/upload/initiate",
            json={"filename": "test.raw", "filesize": 50_000_000},
            headers={"Authorization": f"Bearer {self.token}"}
        )

    @task(1)
    def review_queue(self):
        """Simulate review queue check"""
        self.client.get(
            "/api/review/queue",
            headers={"Authorization": f"Bearer {self.token}"}
        )

    def on_start(self):
        """Get auth token"""
        resp = self.client.post("/api/auth/login", json={...})
        self.token = resp.json()["token"]

# Run: locust -f tests/load_test.py --host=https://parjanya.photos -u 100 -r 10
# Ramps up 100 users at 10/sec, records response times + errors
Cost impact: Run on t3.large EC2 (~$0.10/hour).
Timeline: Run this before Month 3 (after 100 active users).
Gap #3: No capacity planning (#25)
Current state: Ad-hoc scaling based on observational need.
What’s missing:
❌ No forward projections (user growth → resource needs)
❌ No budget forecasting (monthly costs 6–12 months out)
❌ No bottleneck identification (which services will fail first)
❌ No remediation roadmap (when to add read replicas, sharding, etc.)
To resolve:
Assumptions:
├─ 300 users (Month 1) → 500 (Month 6) → 1000 (Month 12)
├─ 1–2 uploads/user/week (500–1000 images each)
├─ 50% growth MoM (conservative)
└─ Average session: 30 min (upload) + 1 hour (browsing)
Monthly Metrics:
├─ API requests: 300 × 3 calls/day = 900 req/day = 30 req/min (M1)
├─ S3 ingestion: 300 × 2 uploads × 500 images = 300K images/month = 15 TB
├─ DynamoDB writes: 15M (EXIF) + 15M (IQA) + 7.5M (thumbnails) = 37.5M writes
├─ CloudFront egress: 15M images × 100 KB thumb = 1.5 TB ≈ $200/month
└─ ECS compute: 2 tasks × $0.0245/hour × 730 hours = $35/month
Growth Projections (scaling):
M1 (300 users):
├─ ALB: 1 × 30 req/min → NO scaling needed
├─ DynamoDB: 37.5M writes → On-demand ✓
├─ S3: 15 TB → Intelligent-Tiering ✓
├─ ECS: 2 tasks (always-warm) ✓
├─ Cost: $235/month ($0.78 per user)
└─ Status: ✓ NO bottlenecks
M6 (500 users):
├─ ALB: 1 × 50 req/min → NO scaling needed
├─ DynamoDB: 62.5M writes → Switch to provisioned if hitting limits
├─ S3: 25 TB → Tiering reduces cost
├─ ECS: 2–4 tasks (auto-scaling active)
├─ Cost: $400/month ($0.80 per user)
└─ Status: ⚠️ DynamoDB on-demand may hit limits, consider switching
M12 (1000 users):
├─ ALB: 2 × 50 req/min → 2 ALB instances (scale)
├─ DynamoDB: 125M writes → Definitely provisioned + read replicas
├─ S3: 50 TB → Add sharding if single prefix hot
├─ ECS: 4 tasks (constant)
├─ Cost: $800/month ($0.80 per user)
└─ Status: 🟢 Stable, cost-effective, no bottlenecks
Timeline: Immediate, update quarterly.
3. Important Gaps (Address in Q2) 🟡
Gap #4: No circuit breaker (#19)
Current state: Retries with exponential backoff (SQS DLQ), but no circuit breaker.
What’s missing:
❌ If S3 becomes slow, all Lambda invocations slow down
❌ If DynamoDB is throttled, entire pipeline waits
❌ No fallback to degraded mode (e.g., skip IQA, just store images)
To resolve:
# parjanya-image-iqa-service/utils/circuit_breaker.py

from pybreaker import CircuitBreaker

s3_breaker = CircuitBreaker(
    fail_max=5,           # 5 failures
    reset_timeout=60,     # then wait 60s before retry
    listeners=[log_cb_event]
)

dynamodb_breaker = CircuitBreaker(
    fail_max=10,
    reset_timeout=120,
    listeners=[log_cb_event]
)

@app.post("/api/upload/initiate")
async def initiate_upload(filename: str, filesize: int):
    try:
        # Try to call S3
        with s3_breaker:
            upload_id = await s3_service.initiate_multipart(filename)

        return {"uploadId": upload_id, "status": "ok"}

    except CircuitBreakerListener:
        # S3 is down, return error to user
        logger.error("S3 circuit breaker open, falling back to queue")
        return {
            "status": "queued",
            "message": "Upload will be processed when S3 recovers"
        }
Cost impact: pybreaker library is free.
Timeline: Adding in Q2 2026 (post-launch stability phase).
Gap #5: No graceful degradation (#32)
Current state: All or nothing (if IQA fails, entire upload fails).
What’s missing:
❌ Upload succeeds, IQA skipped (user doesn’t know image quality)
❌ Thumbnail fails, but original is still accessible
❌ Review queue temporarily unavailable, but gallery still works
To resolve:
# parjanya-image-iqa-service/services/iqa_service.py

async def analyze_image_with_fallback(s3_key: str):
    """
    Try DepictQA. If it fails, fall back to basic BRISQUE.
    If both fail, mark as 'unreviewed' and let user review manually.
    """

    try:
        # Tier 1: Full DepictQA
        result = await depictqa_service.analyze(s3_key)
        return {"score": result["score"], "source": "depictqa"}

    except DepictQATimeoutError:
        logger.warning(f"DepictQA timeout for {s3_key}, falling back to BRISQUE")
        try:
            # Tier 2: Fast BRISQUE (no-reference quality)
            score = await brisque_service.score(s3_key)
            return {"score": score, "source": "brisque"}

        except Exception as e:
            logger.error(f"BRISQUE also failed, marking for manual review: {str(e)}")
            # Tier 3: Manual review (user decides)
return {"score": None, "source": "manual_review", "status": "pending"}Timeline: Adding in Q2 2026 (post-launch).
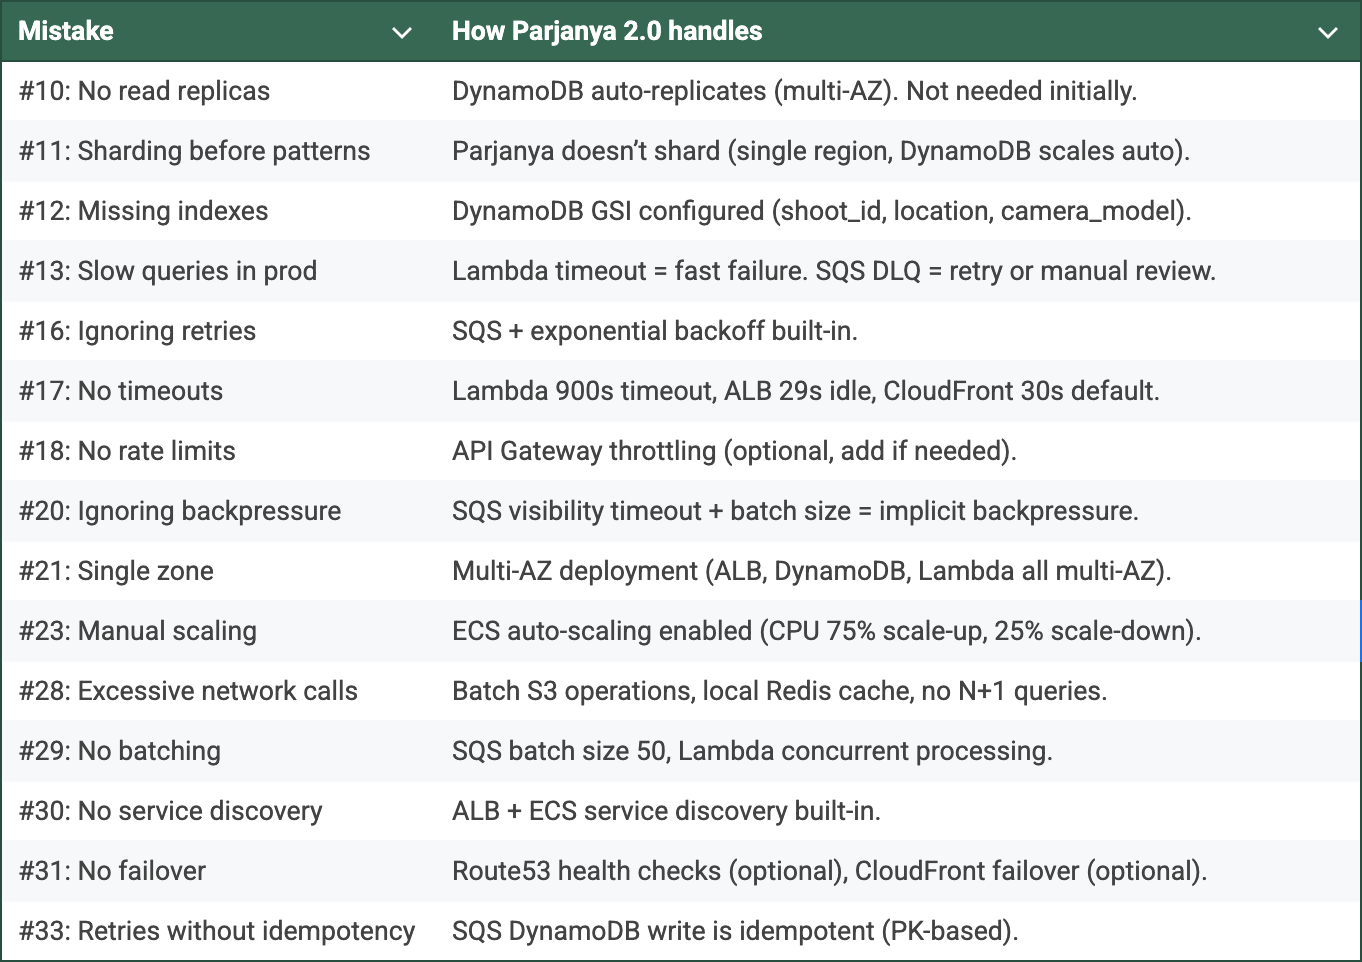
4. Mistakes Parjanya Handles Well 💚
5. Summary: What to Add Before Scaling
Immediate (Month 1) 🔴
□ Add AWS Lambda Powertools for structured logging
□ Enable X-Ray tracing on Lambda/ALB
□ Create CloudWatch dashboard (request rate, latency, errors)
□ Set up SNS alerts for errors (email/Slack)
□ Document capacity planning spreadsheet
□ Capacity planning for next 12 months
Time: 1–2 days
Cost: ~$20/month (CloudWatch Logs)
Blocker: None (can be added to existing architecture)
Important (Q2 2026) 🟡
□ Run load test (Locust) with 100 concurrent users
□ Add circuit breaker for external services (S3, DynamoDB)
□ Implement graceful degradation (IQA optional, manual fallback)
□ Set up API rate limiting (if abuse occurs)
Time: 3–5 days
Cost: ~$50/month (load testing infrastructure)
Blocker: None (can be added post-launch)
Nice-to-Have (Year 2) 💚
□ Add DynamoDB read replicas (if single-region throughput saturates)
□ Implement S3 prefix sharding (if single user’s uploads = bottleneck)
□ Multi-region failover (if global SLA required)
□ Sentry/Rollbar for error tracking (already have CloudWatch)
Time: 5–10 days each
Cost: $100–500/month
Blocker: None (these are optimizations, not critical)
6. Risk Assessment: What Will Break First?
At 300 users (current scale):
✓ No bottlenecks. System is well-designed.
At 500 users (Month 6):
⚠️ Potential concern: DynamoDB on-demand pricing (37.5M→62.5M writes)
→ Monitor write throttle errors
→ If seen, switch to provisioned mode (100 RCU, 100 WCU)
→ Cost increases to $50/month (vs. $5 on-demand), but guaranteed capacity
At 1000 users (Month 12):
⚠️ Potential concern: ALB request rate (50/min is well below capacity)
→ No issue expected
⚠️ Potential concern: Lambda cold starts (not significant due to batch SQS)
→ No issue expected
✓ ECS auto-scaling activates (4+ tasks), cost increases to $100/month
✓ CloudFront CDN smooths spike traffic (no backend impact)
